
Welcome To Our Stop Loss Method Results Page.
For those interested in scaling Prop Accounts, here are the results of our methodology.
Let's See Them!TTM STOP LOSS SERIES
--
The Trading Mentor Team has used our human traded Stop Loss Methodology and codified it into something that can be applied to any asset in a mixed portfolio.
The following short video series demonstrates this on the most recent and relevant years in Forex Markets.
All videos demonstrate safe Trading parameters and net gains through various different Markets Cycles/Conditions.
The sizes are the same on all tests (in terms of % risk).
--
--
--
--
--
--
--
--
--
--
--
--
For 2016-2019 Years:
--
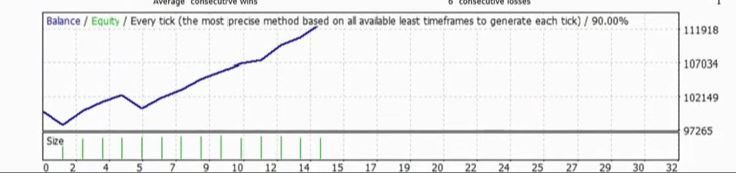
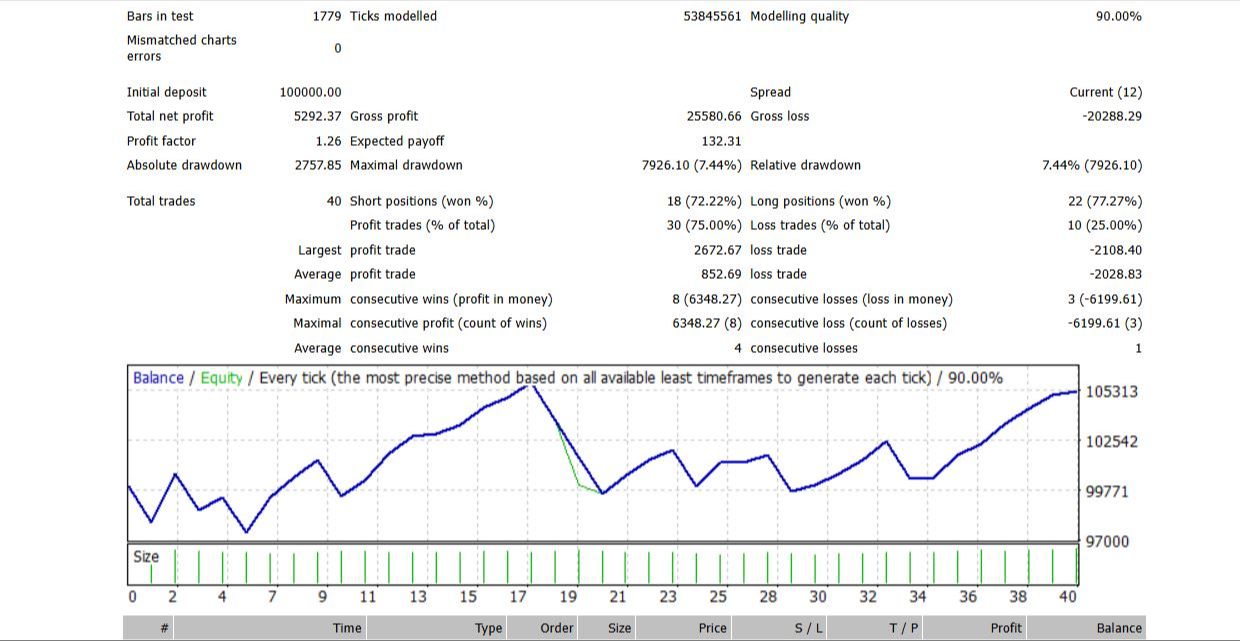
AUDUSD (2016 - 2019)
40 Trades, 5.29% gains, 75% WR, Under 2.7% DD.
--
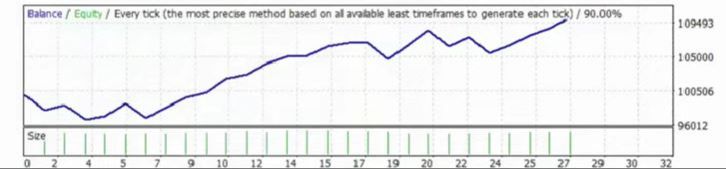
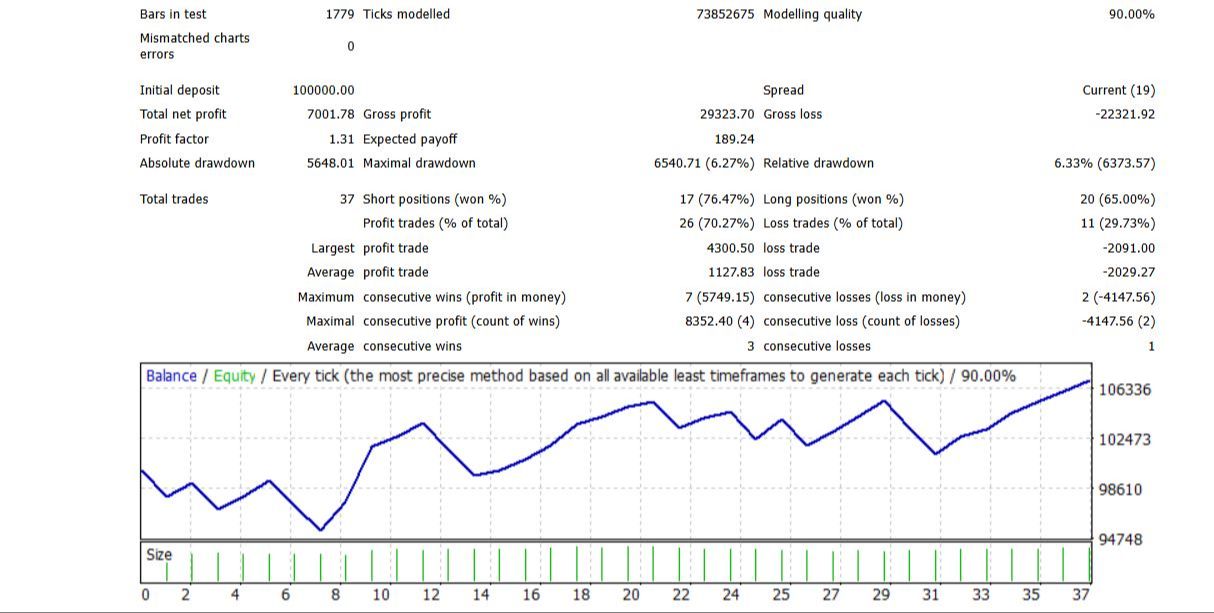
GBPUSD (2016-2019)
37 Trades, 7% Gains, 70% WR, Under 5% DD.
--
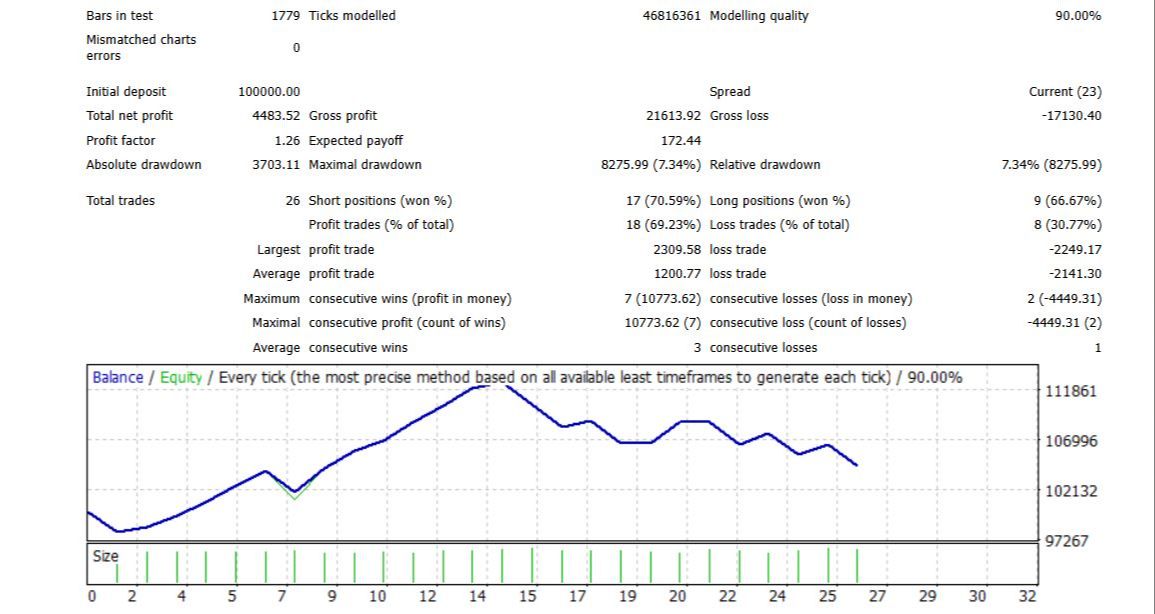
NZDUSD (2016-2019)
26 Trades, 4.48% Gains, 69.23% WR, Under 2% DD.
--
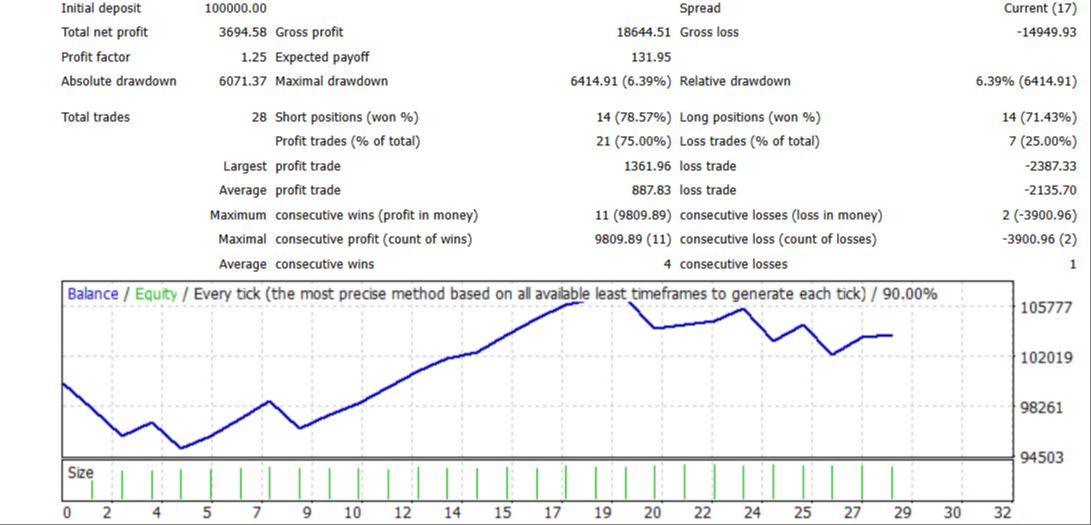
USDCAD (2016-2019)
28 Trades, 3.7% Gains, 5% Max Drawdown, 70% WR.
--
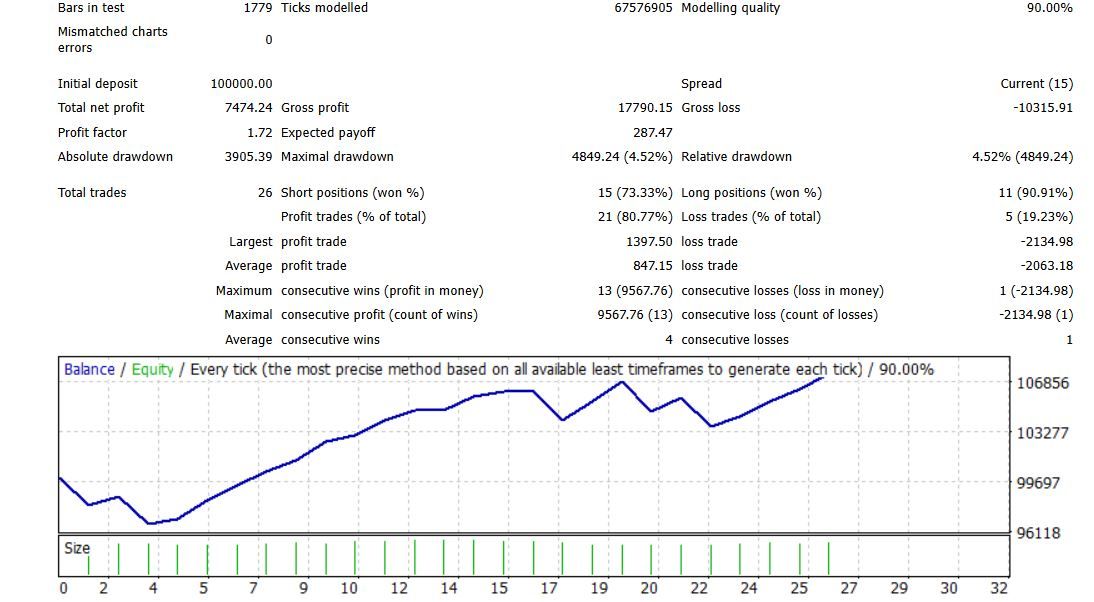
EURUSD (2016-2019)
26 Trades, 7.4% Gains, Under 3.9% Max Drawdown, 80.77% WR.
--
AUDNZD (2016-2019)
55 Trades, 14.65% Gains, 0% Max Drawdown, 83.64% WR.
--
CADCHF
8 Trades, 3.87% Gains, 0% Max Drawdown, 75% WR.
--
NZDCAD
28 Trades, 1.875% Gains, 3.7% Max Drawdown, 78.57% WR.
--
EURNZD (2016-2019)
15 Trades, 3.16% Gains, 2% Max Drawdown, 80% WR.
--
USDCHF (2016-2019)
22 Trades, 3.26% Gains, 1.25% Max Drawdown, 80% WR.
--
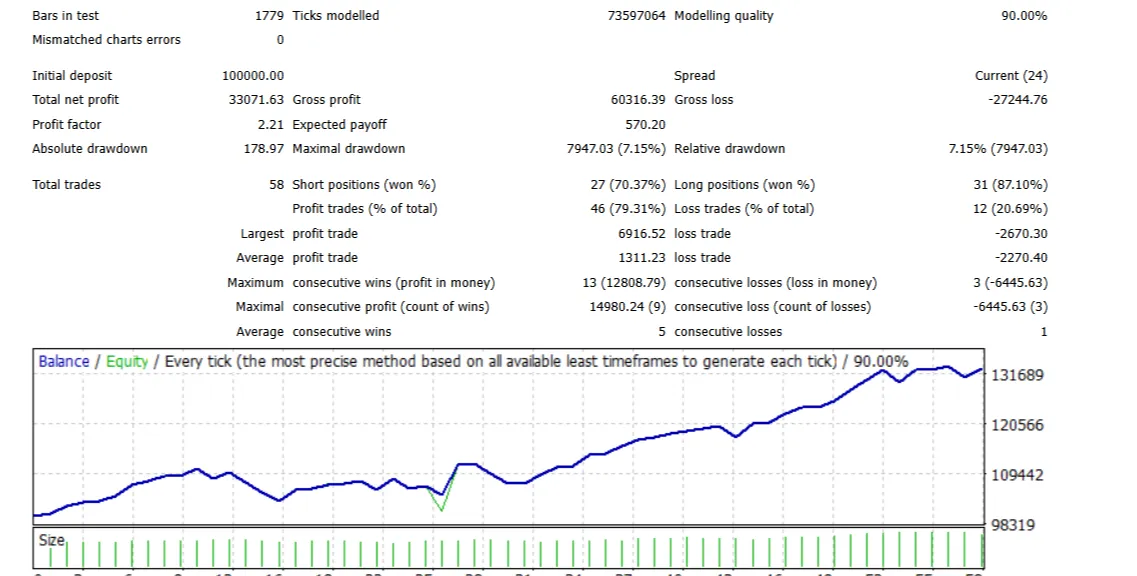
AUDCAD (2016-2019)
58 Trades, 33.07% Gains, 79.31% WR, 0% Max Drawdown.
--
More Tests To Come..
--
Where's The Covid Year?
We ran the EA on 2020, but its important to remember that the real methodology is human based.
So, because of the Black Swan experience between 2020-21, the EA either makes a small loss or breaks even.
In real life, you would either not trade or just trade tiny sizes to get through. Even a small loss or breakeven is better than having your entire account liquidated.
So to stop the results being skewed, we are running on the years either side of this event.
If you factor in the year before, or the year after, it puts you into gains and removes Covid losses.
If you take the 10 year running gains, we are in a huge positive (based on our results & EA).
--
Final Stats (and things to remember):
1. When reading these that the risk parameters were kept purposely low.
That does mean, in reality, we could've ran every single test at 5-7X Risk without hitting a margin call or getting near to it (within leverage reason, it's absolutely not something we suggest).
2. Secondly, remember you could be running multiple assets in the same year, so the individual results could be added together provided the other entries you took did not clash (in other words you didn't short EU and GU at the exact same time).
3. & Thirdly, also take note that once the gains started to compound the stop loss amount could also be moved and risk parameters could grow.
For example, being $20K up on a $100K account essentially gives 20% more breathing space for size to grow.
The sizes in these tests were put out to be useable on prop firms where most max SL's are 10%.
Results:
AUDUSD - 14.7% Gains, 2.7% Max Drawdown.
AUDNZD - 24.05% Gains, 0% Drawdown.
AUDCAD - 35.82% Gains, 0% Drawdown.
GBPUSD - 19.76% Gains, 5% Max Drawdown.
NZDUSD - 10.68% Gains, 1.9% Max Drawdown.
EURUSD - 14.11% Gains, 3% Max Drawdown.
USDCAD - 16.51% Gains, 5% Max Drawdown.
NZDCAD - 6% Gains, 3.7% Max Drawdown.
CADCHF - 12.83% Gains, 0% Max Drawdown.
EURNZD - 14.2% Gains, 2% Max Drawdown.
USDCHF - 11.77% Gains, 1.25% Max Drawdown
